
Myofiber Morphology with Fluorescence
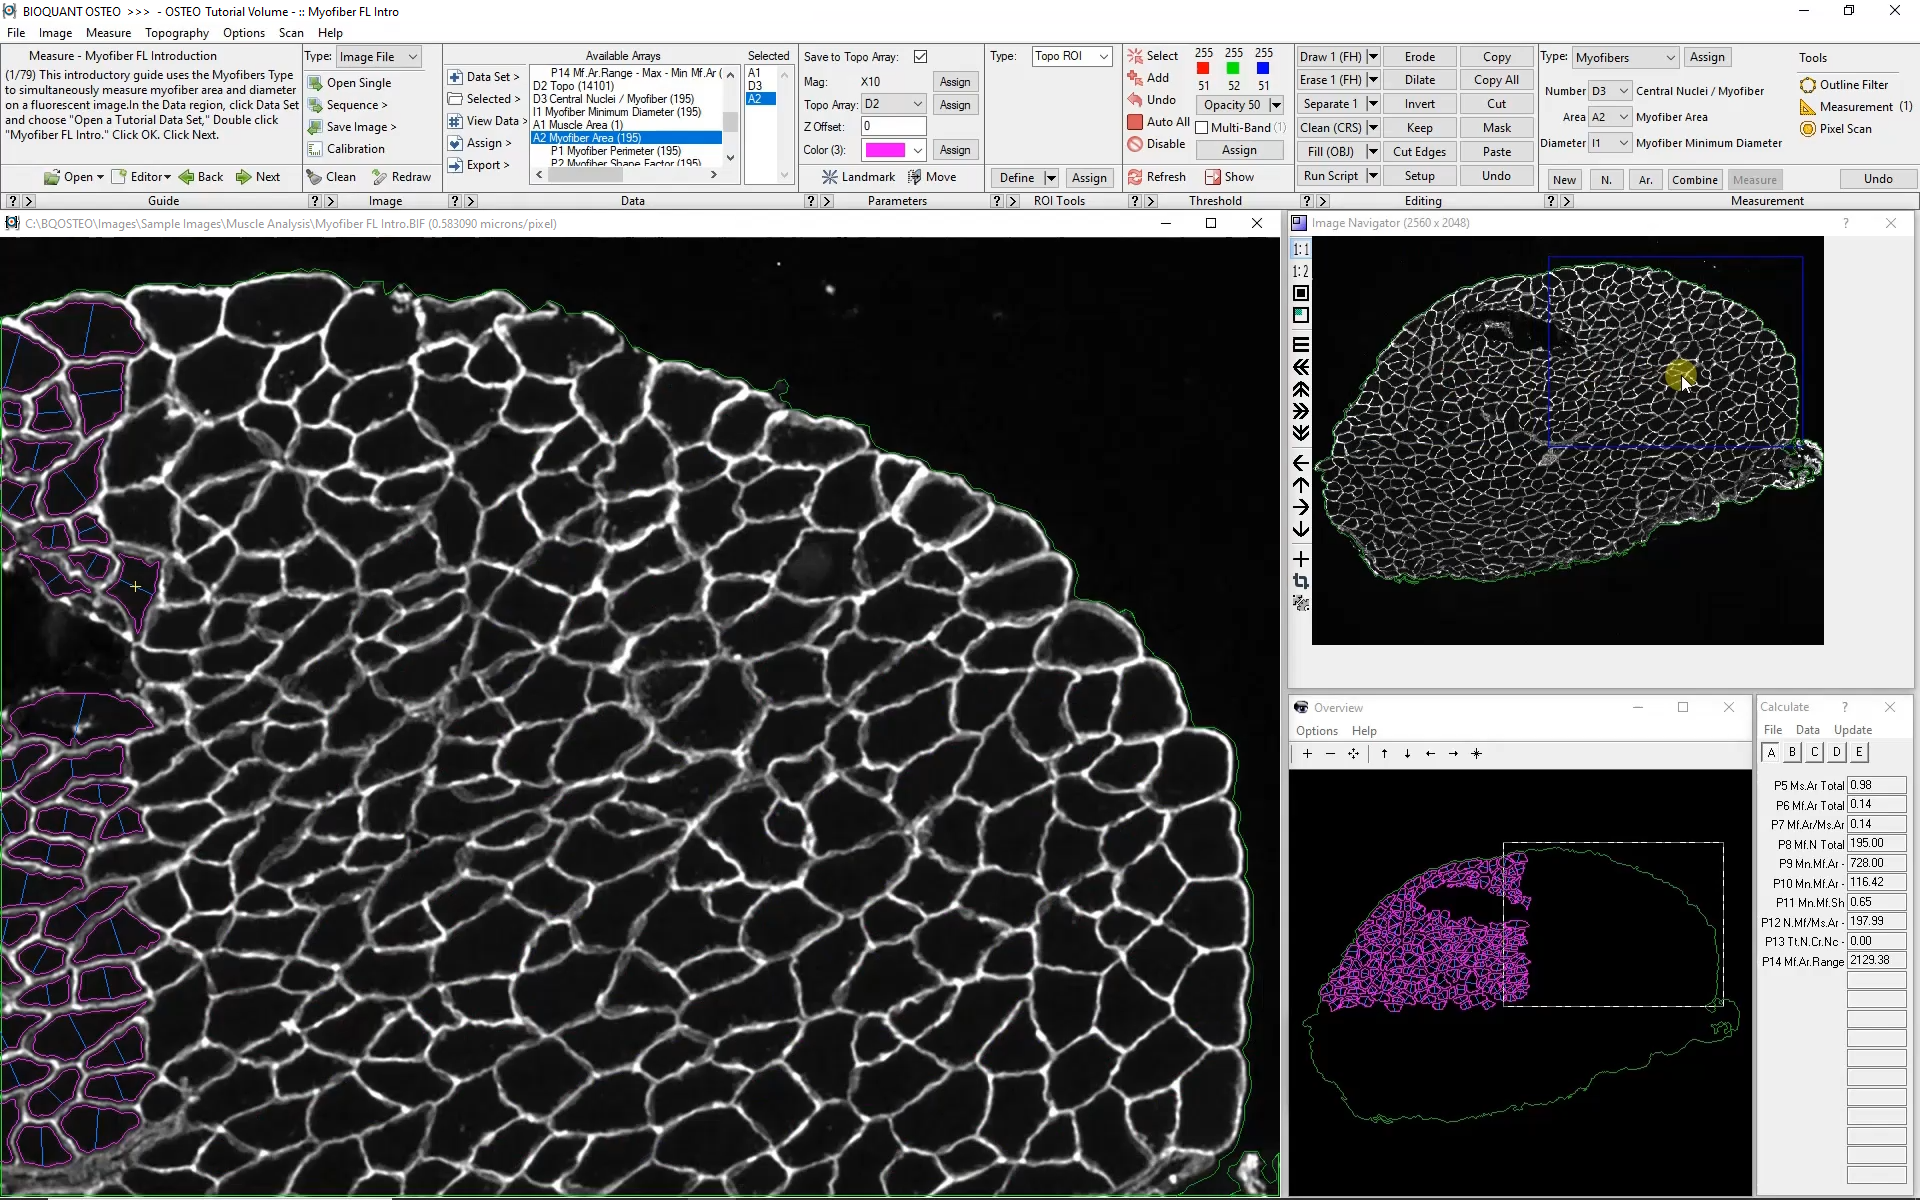
Defining the Muscle Boundary

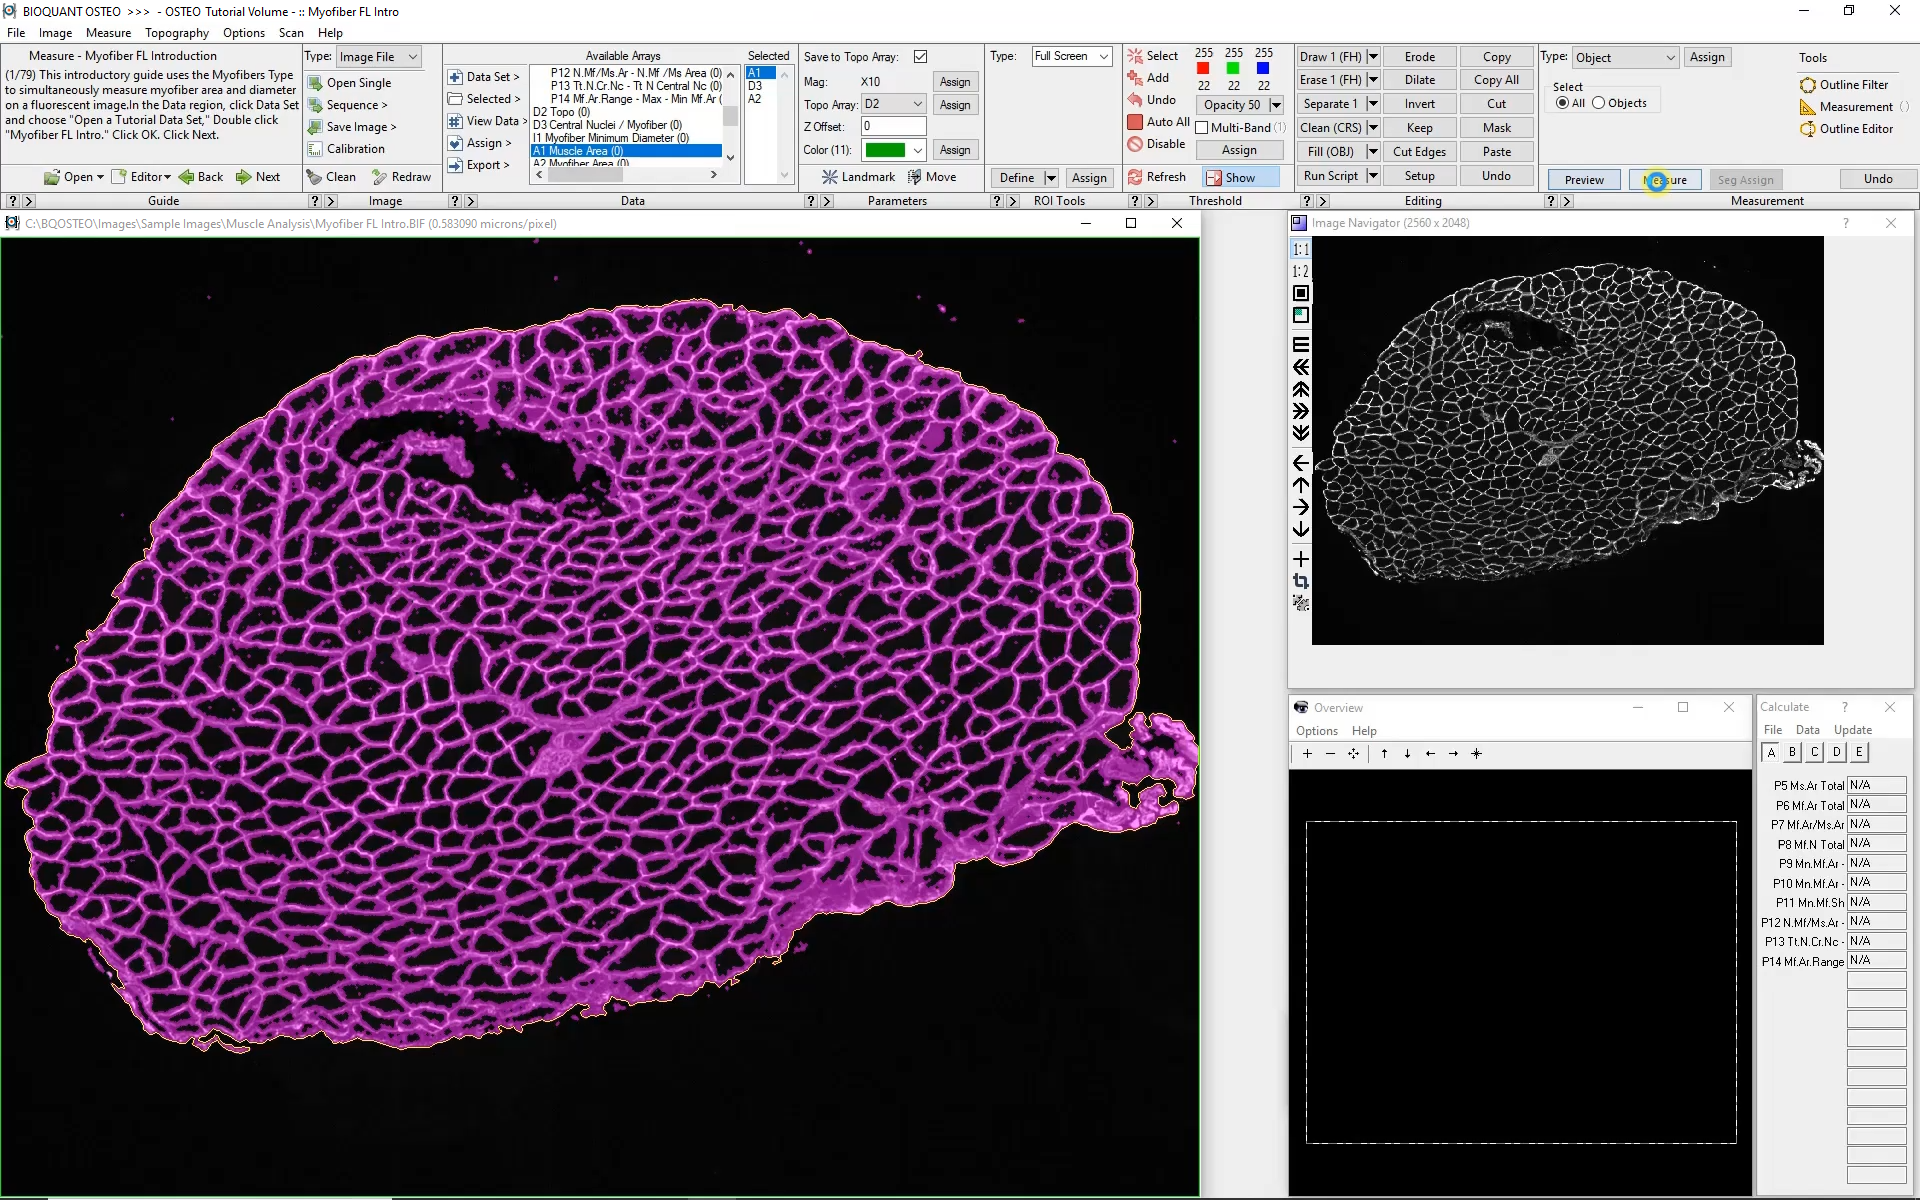

At low magnification, the outer edge of the section is traced automatically. This will form the boundary for myofiber analysis at higher magnification. The software can move automatically from field to field collecting myofiber morphology data, all while remaining within the previously defined boundary.
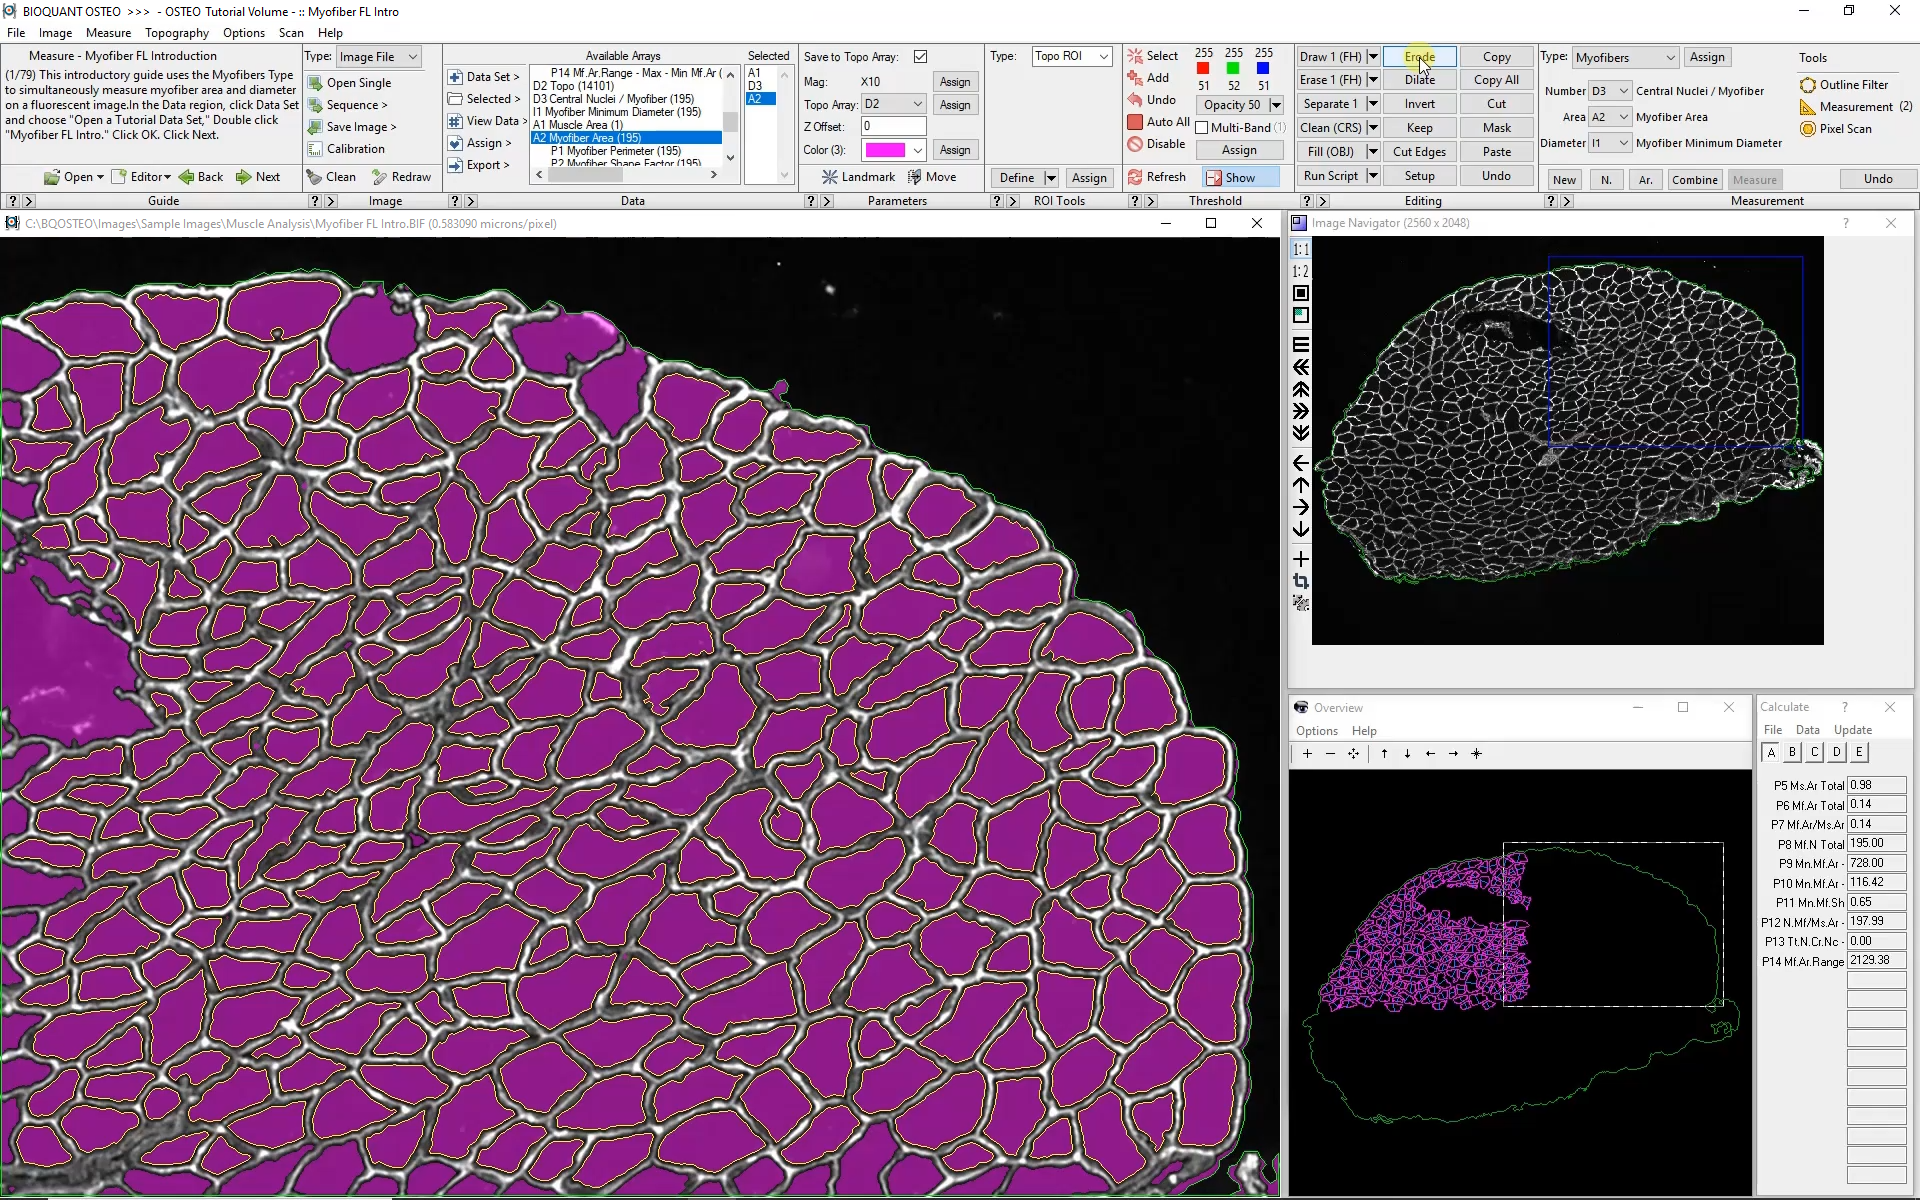
Automatic Myofiber Detection
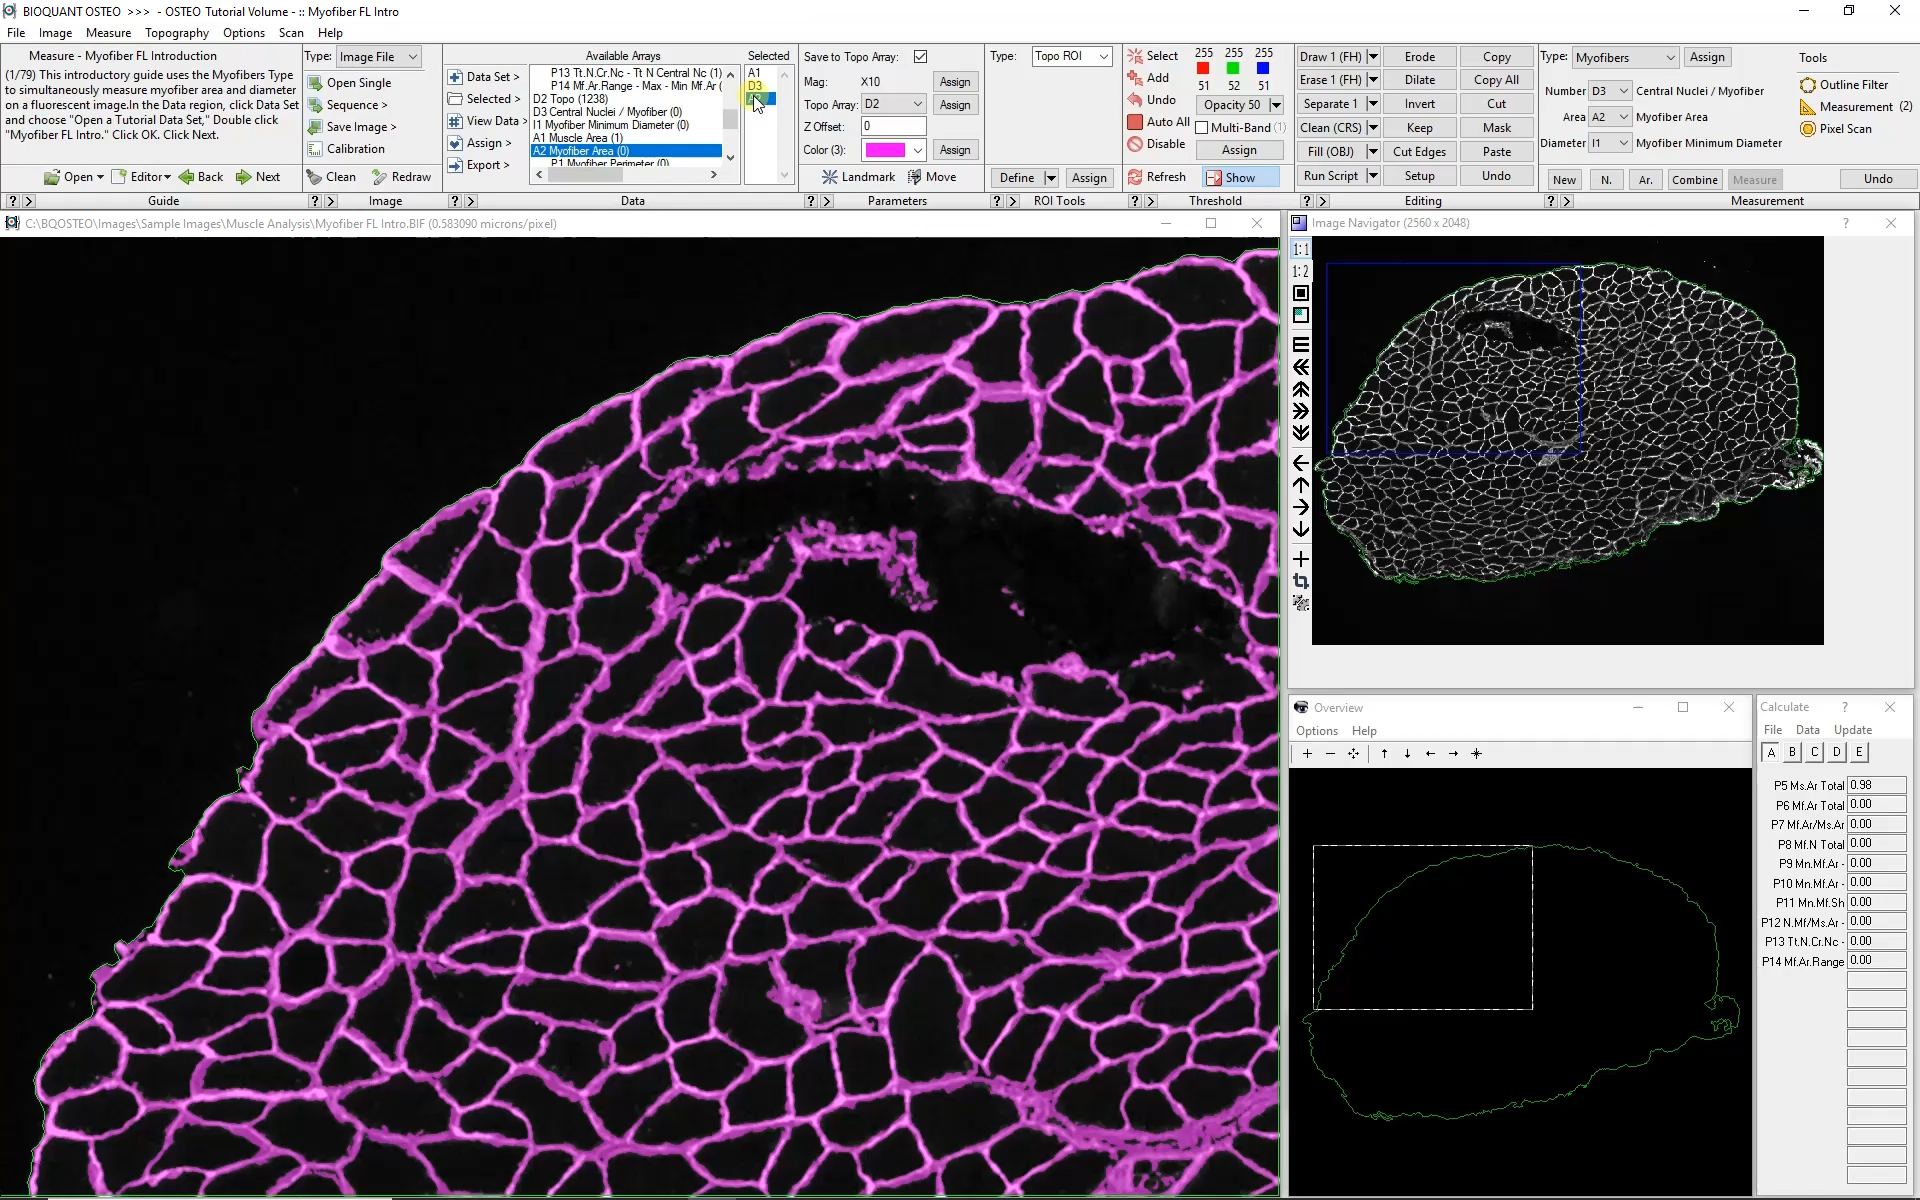

Automated analysis of myofibers depends on a high-contrast label applied to the boundary of each myofiber. Generally this requires a label specific to dystrophin or laminin.
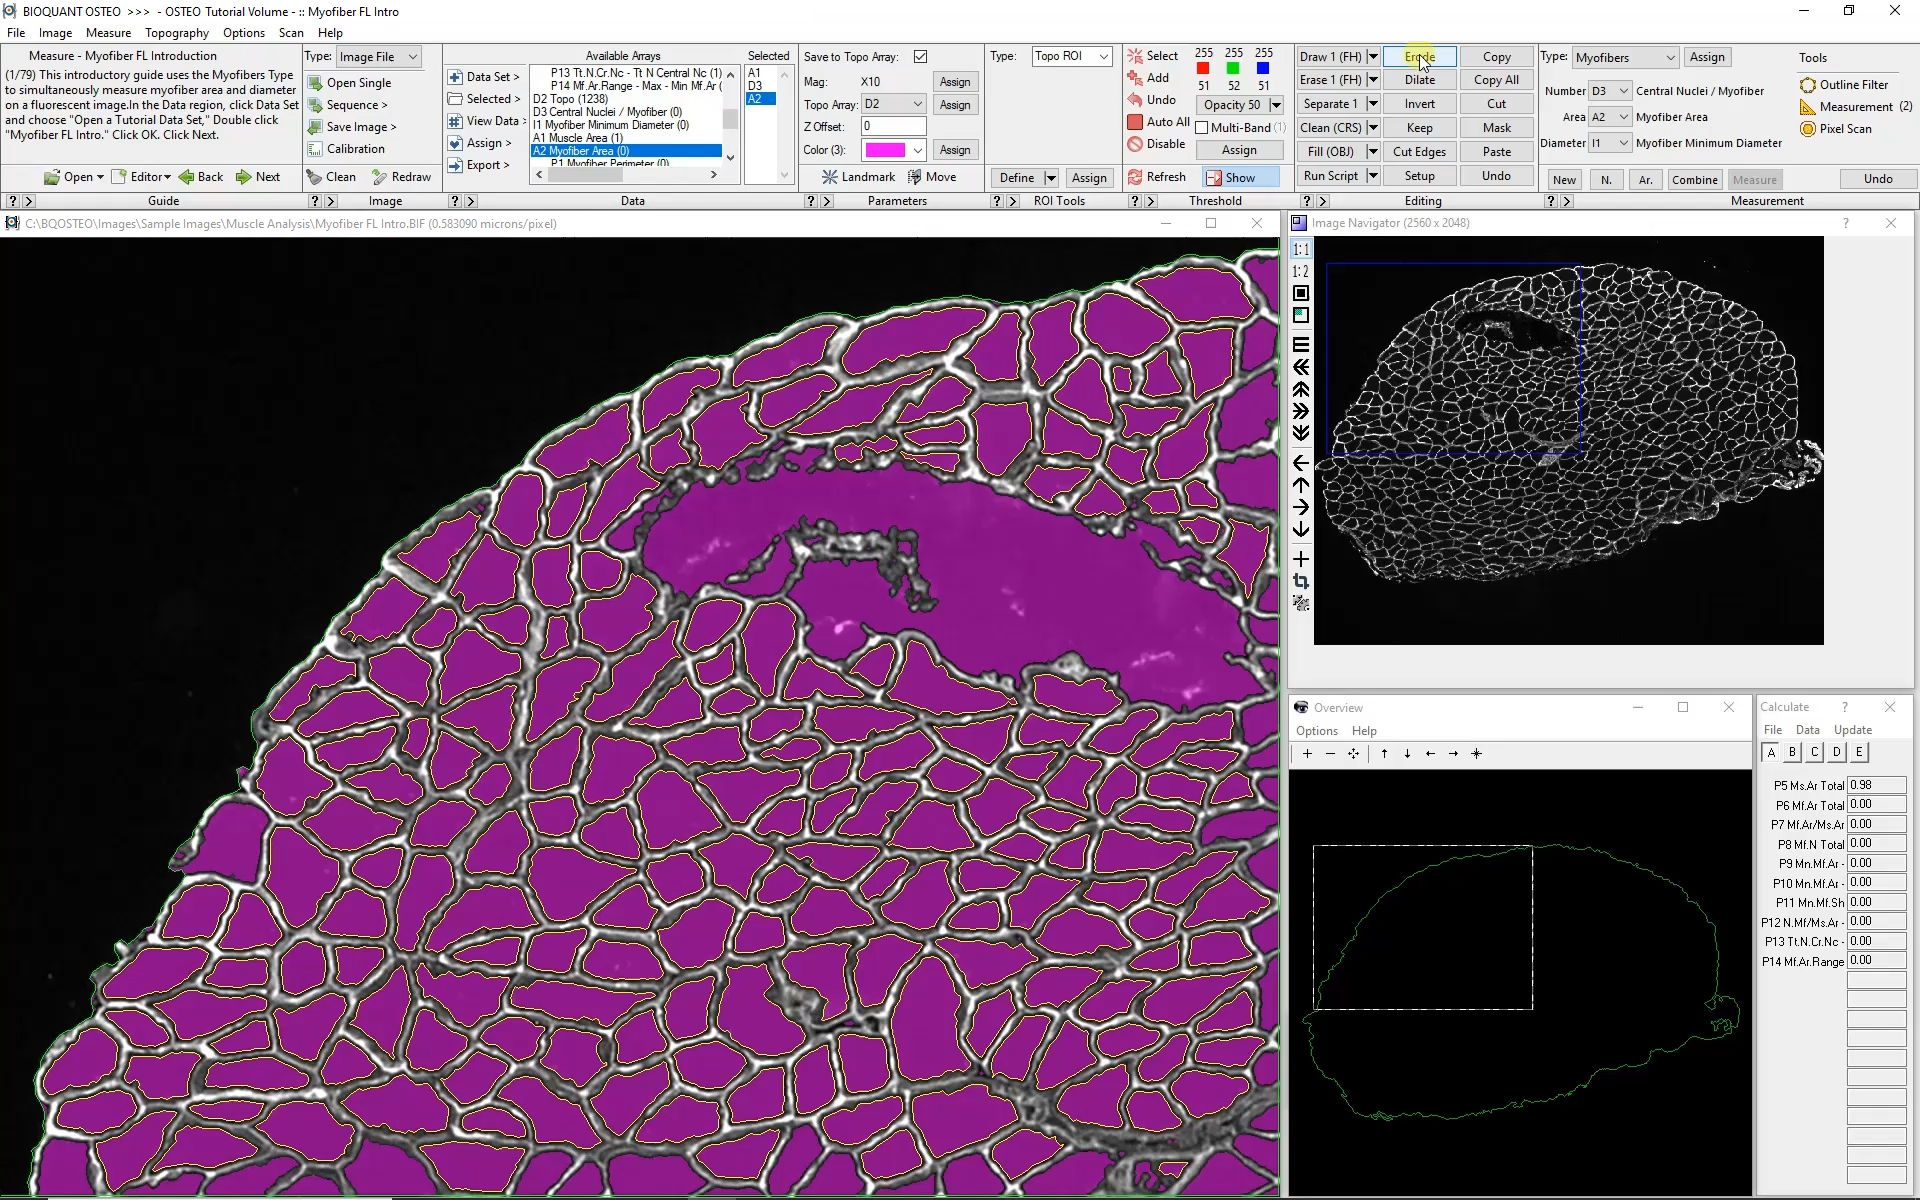
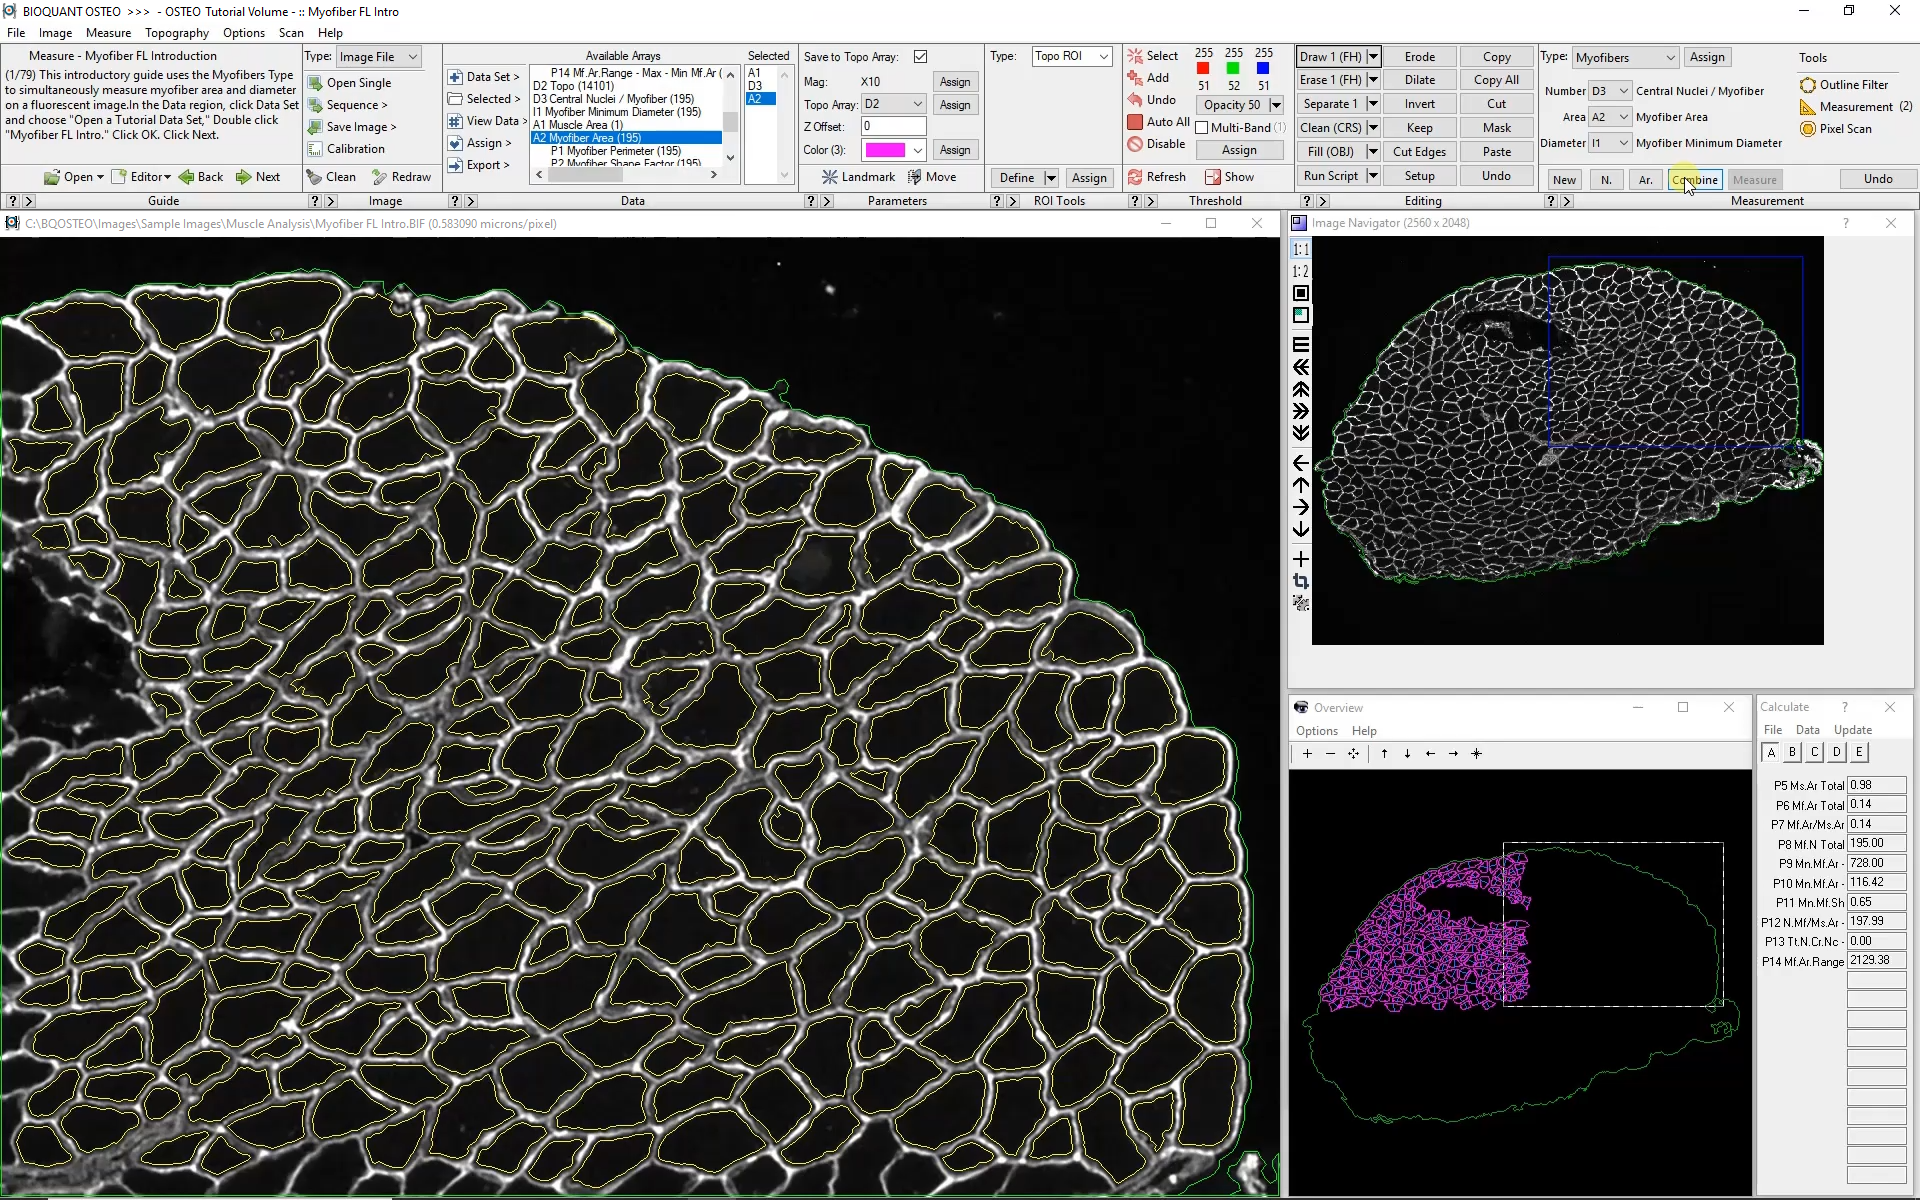
Automatic color thresholding uses this boundary stain to identify the myofibers. Manual editing with a brush and eraser makes it simple to correct mistakes.
Intelligent filters remove previously measured myofibers and myofibers that are not entirely visible within the field of view.
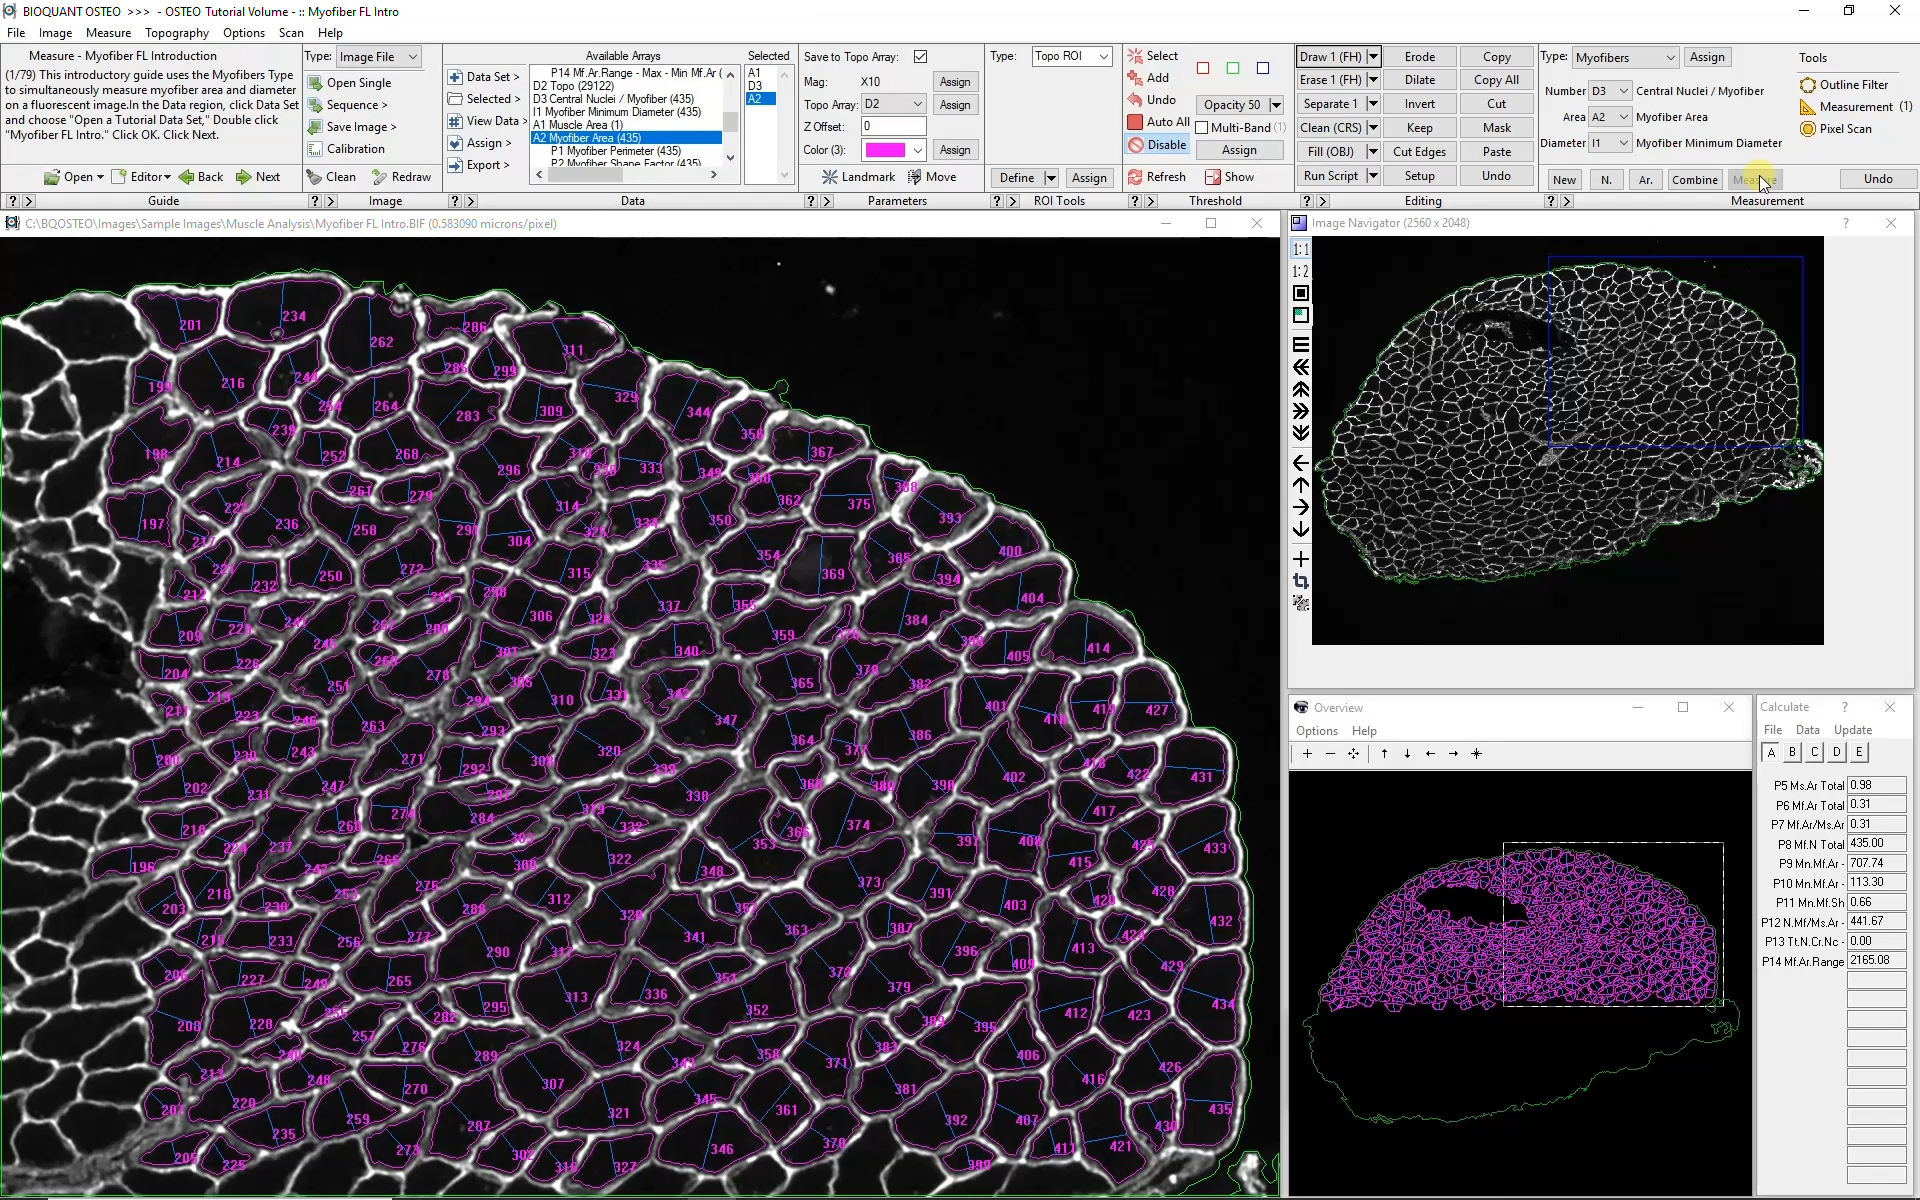
Measuring Myofibers
Click image to enlarge.
BIOQUANT simultaneously collects the following data from each myofiber:
Myofiber Cross-sectional Area
Myofiber Shortest Diameter
Myofiber Perimeter
Myofiber Location
Myofiber Circularity
Number of Myofibers
Number of Central Nuclei per Myofiber
It's not possible to determine fibertype from laminin staining alone. An additional label for dna would be needed to allow the software to determine the number of centrally located nuclei per myofiber.
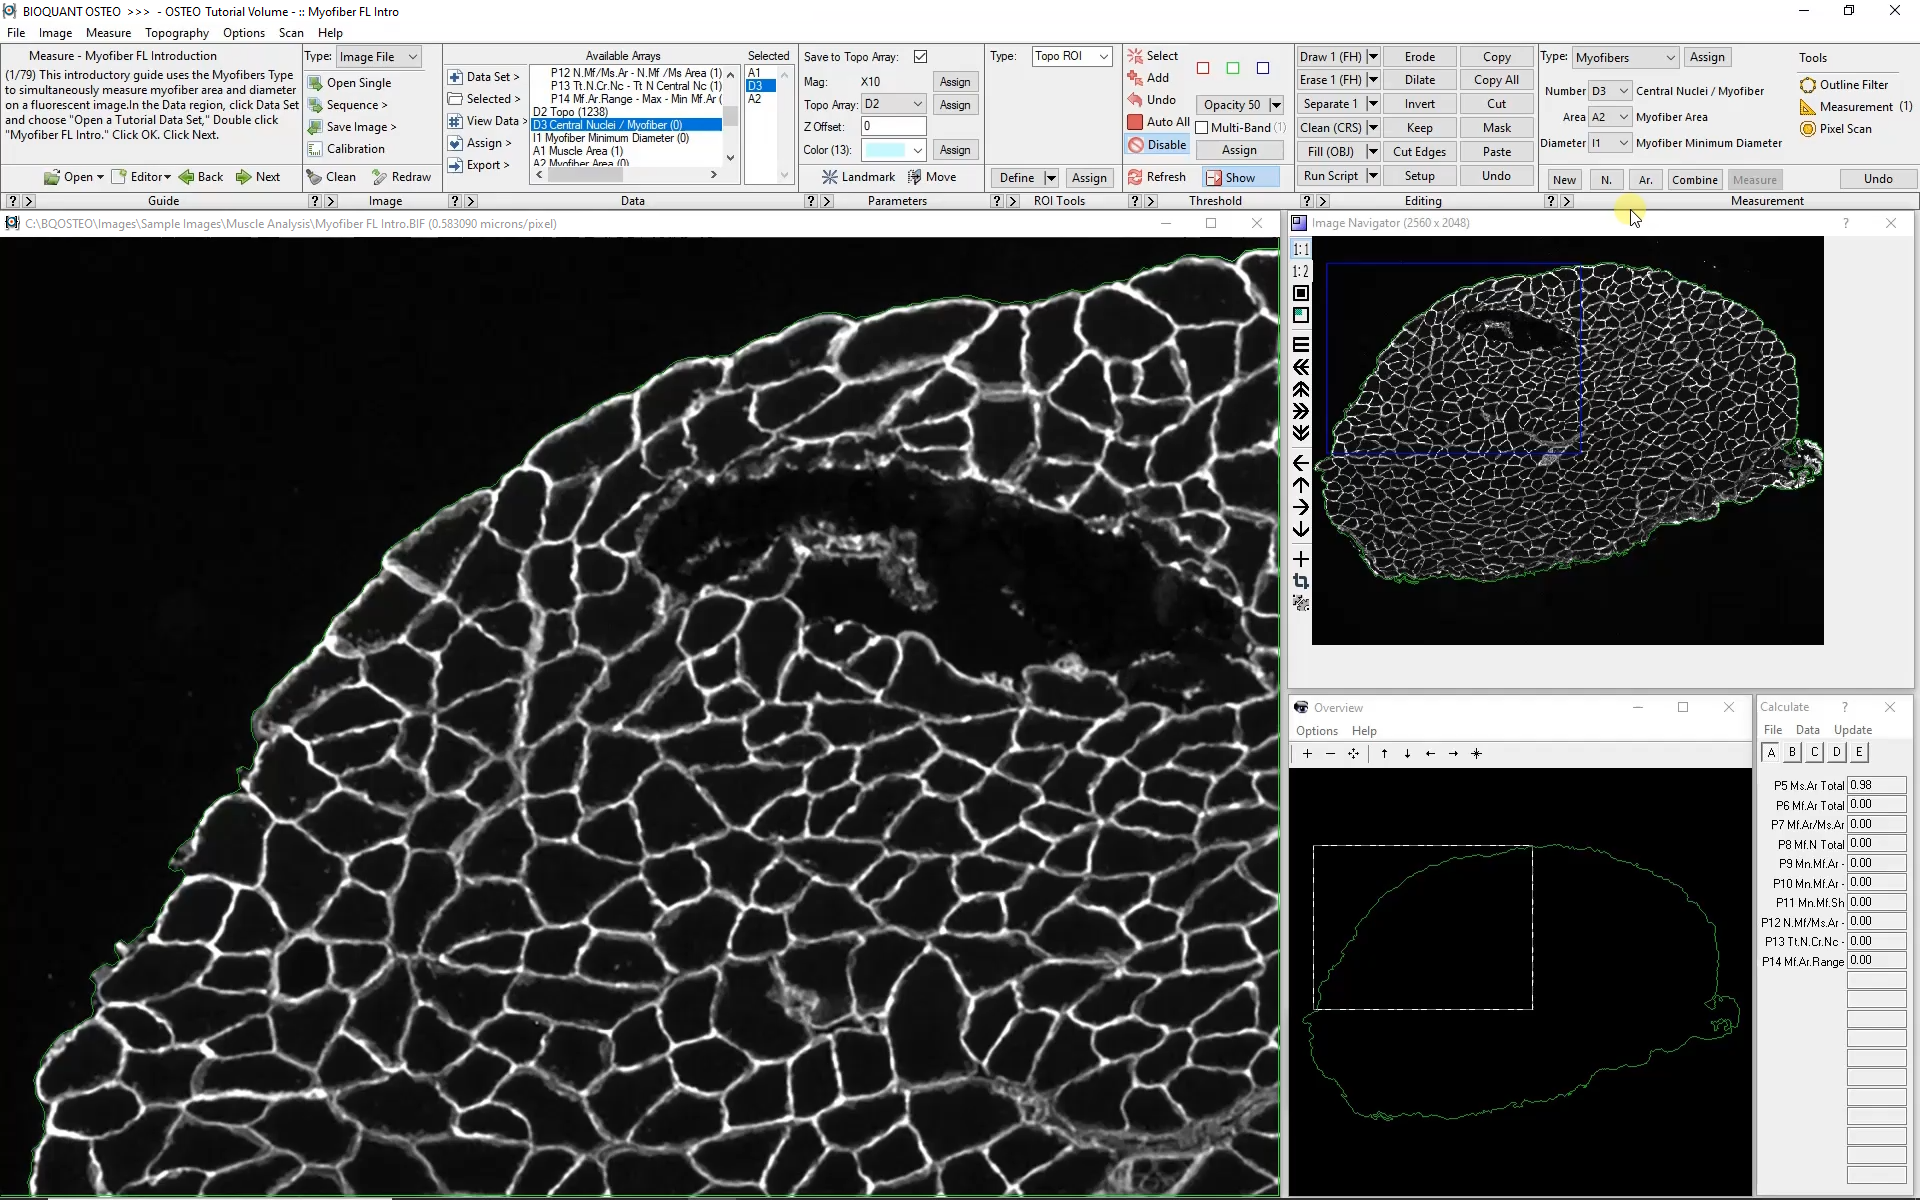
Subsequent Fields of View

The Large Image Navigator in BIOQUANT makes it simple to move sequentially through a large section in consecutive, overlapping fields of view. BIOQUANT automatically tracks the boundary of the muscle and skips fields of view which are outside the muscle boundary.